项目解读
学习GDB-extension
学习目的
- 看python如何实现gdb-extension
学习如何实现基于Python和GDB工作,主要参考:
Cython
学习目的
- 学习Cython-Debuger的工作原理
Inspector
类似于PDB的CPP断点设置方法
SageMath
项目简述
开源的数学软件系统
SageMath is a free, open-source mathematical software system based on the Python programming language. It covers a wide range of mathematical areas including algebra, calculus, number theory, geometry, graph theory, combinatorics and much more. It is used to perform calculations, graphing, simulations, and modeling in physics, cryptography, coding theory, optimization and indeed in all of mathematical fields.
学习目的
- 了解大型cython项目开发的workflow
- 如何测试
- 如何调试
- 探索数学计算系统的软件架构
developer's guide
来这里可以看到sage的开发workflow,我们重点关注Writing Code for Sage
为了学习如何调试Cython,搭建一个sagemath的开发/测试环境非常有必要,因此...
搭建环境过程
接下来,由于我们主要关心的是cython部分的developing workflow,我们进入Coding in cython
首先我们注意到,sage notebook中可以通过%cython来运行cython代码,但实际上和我们使用Pyximport的过程差不多,当运行该cell,实际发生的事情有:
- 代码被保存成了文件
- cython编译系统工作,同时,代码所需的标准sage库会被自动链接
- 代码的产物(
.so/.dll/.dylib)会被load进当前的sage实例中(动态链接)
上述机制,使得快速验证功能变得自动化,但并非断点调试,始终存在局限性
memray
项目简述
USE CASE
实时的内存视图
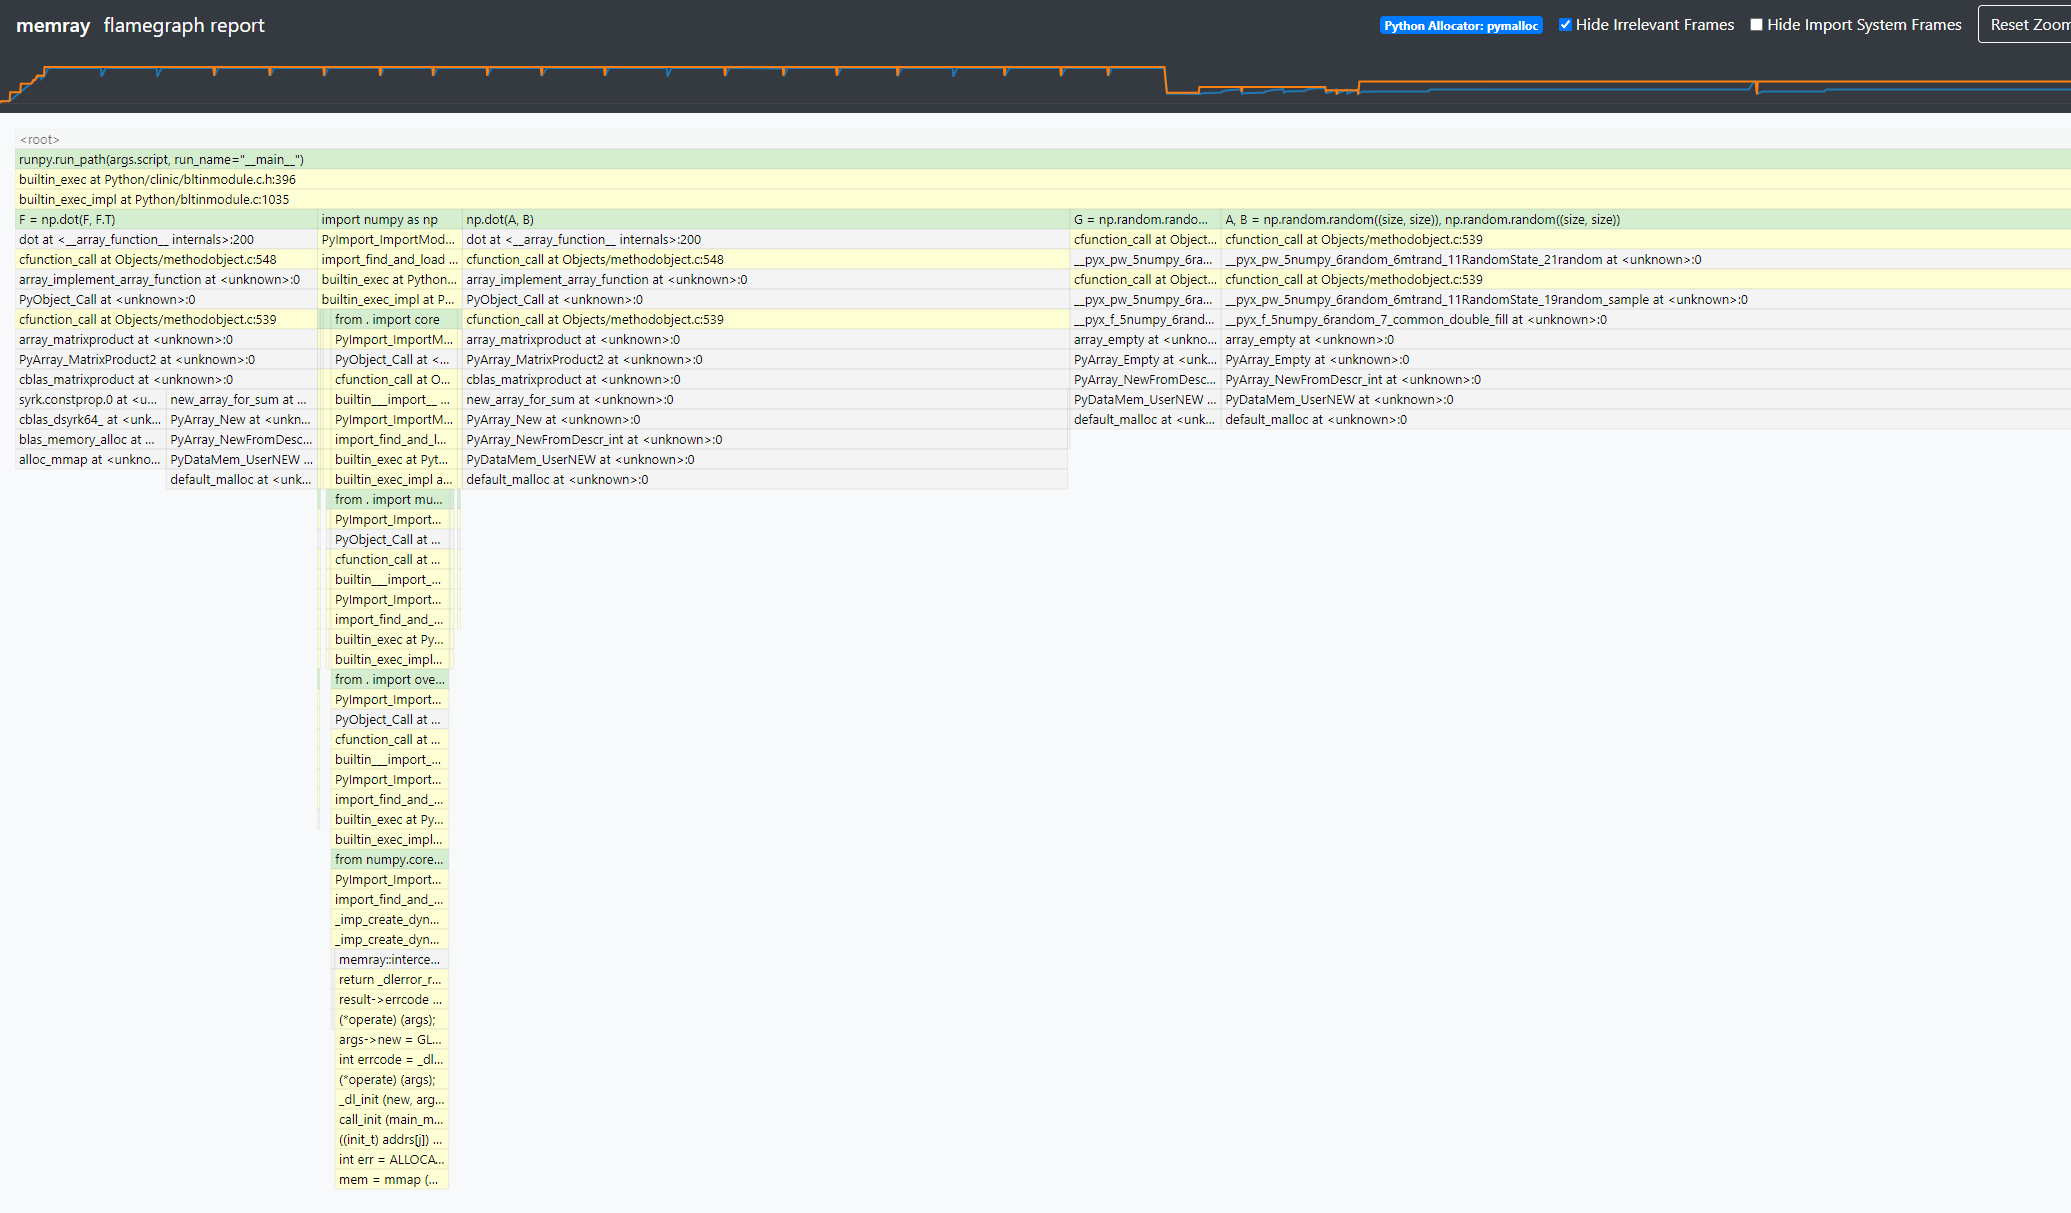
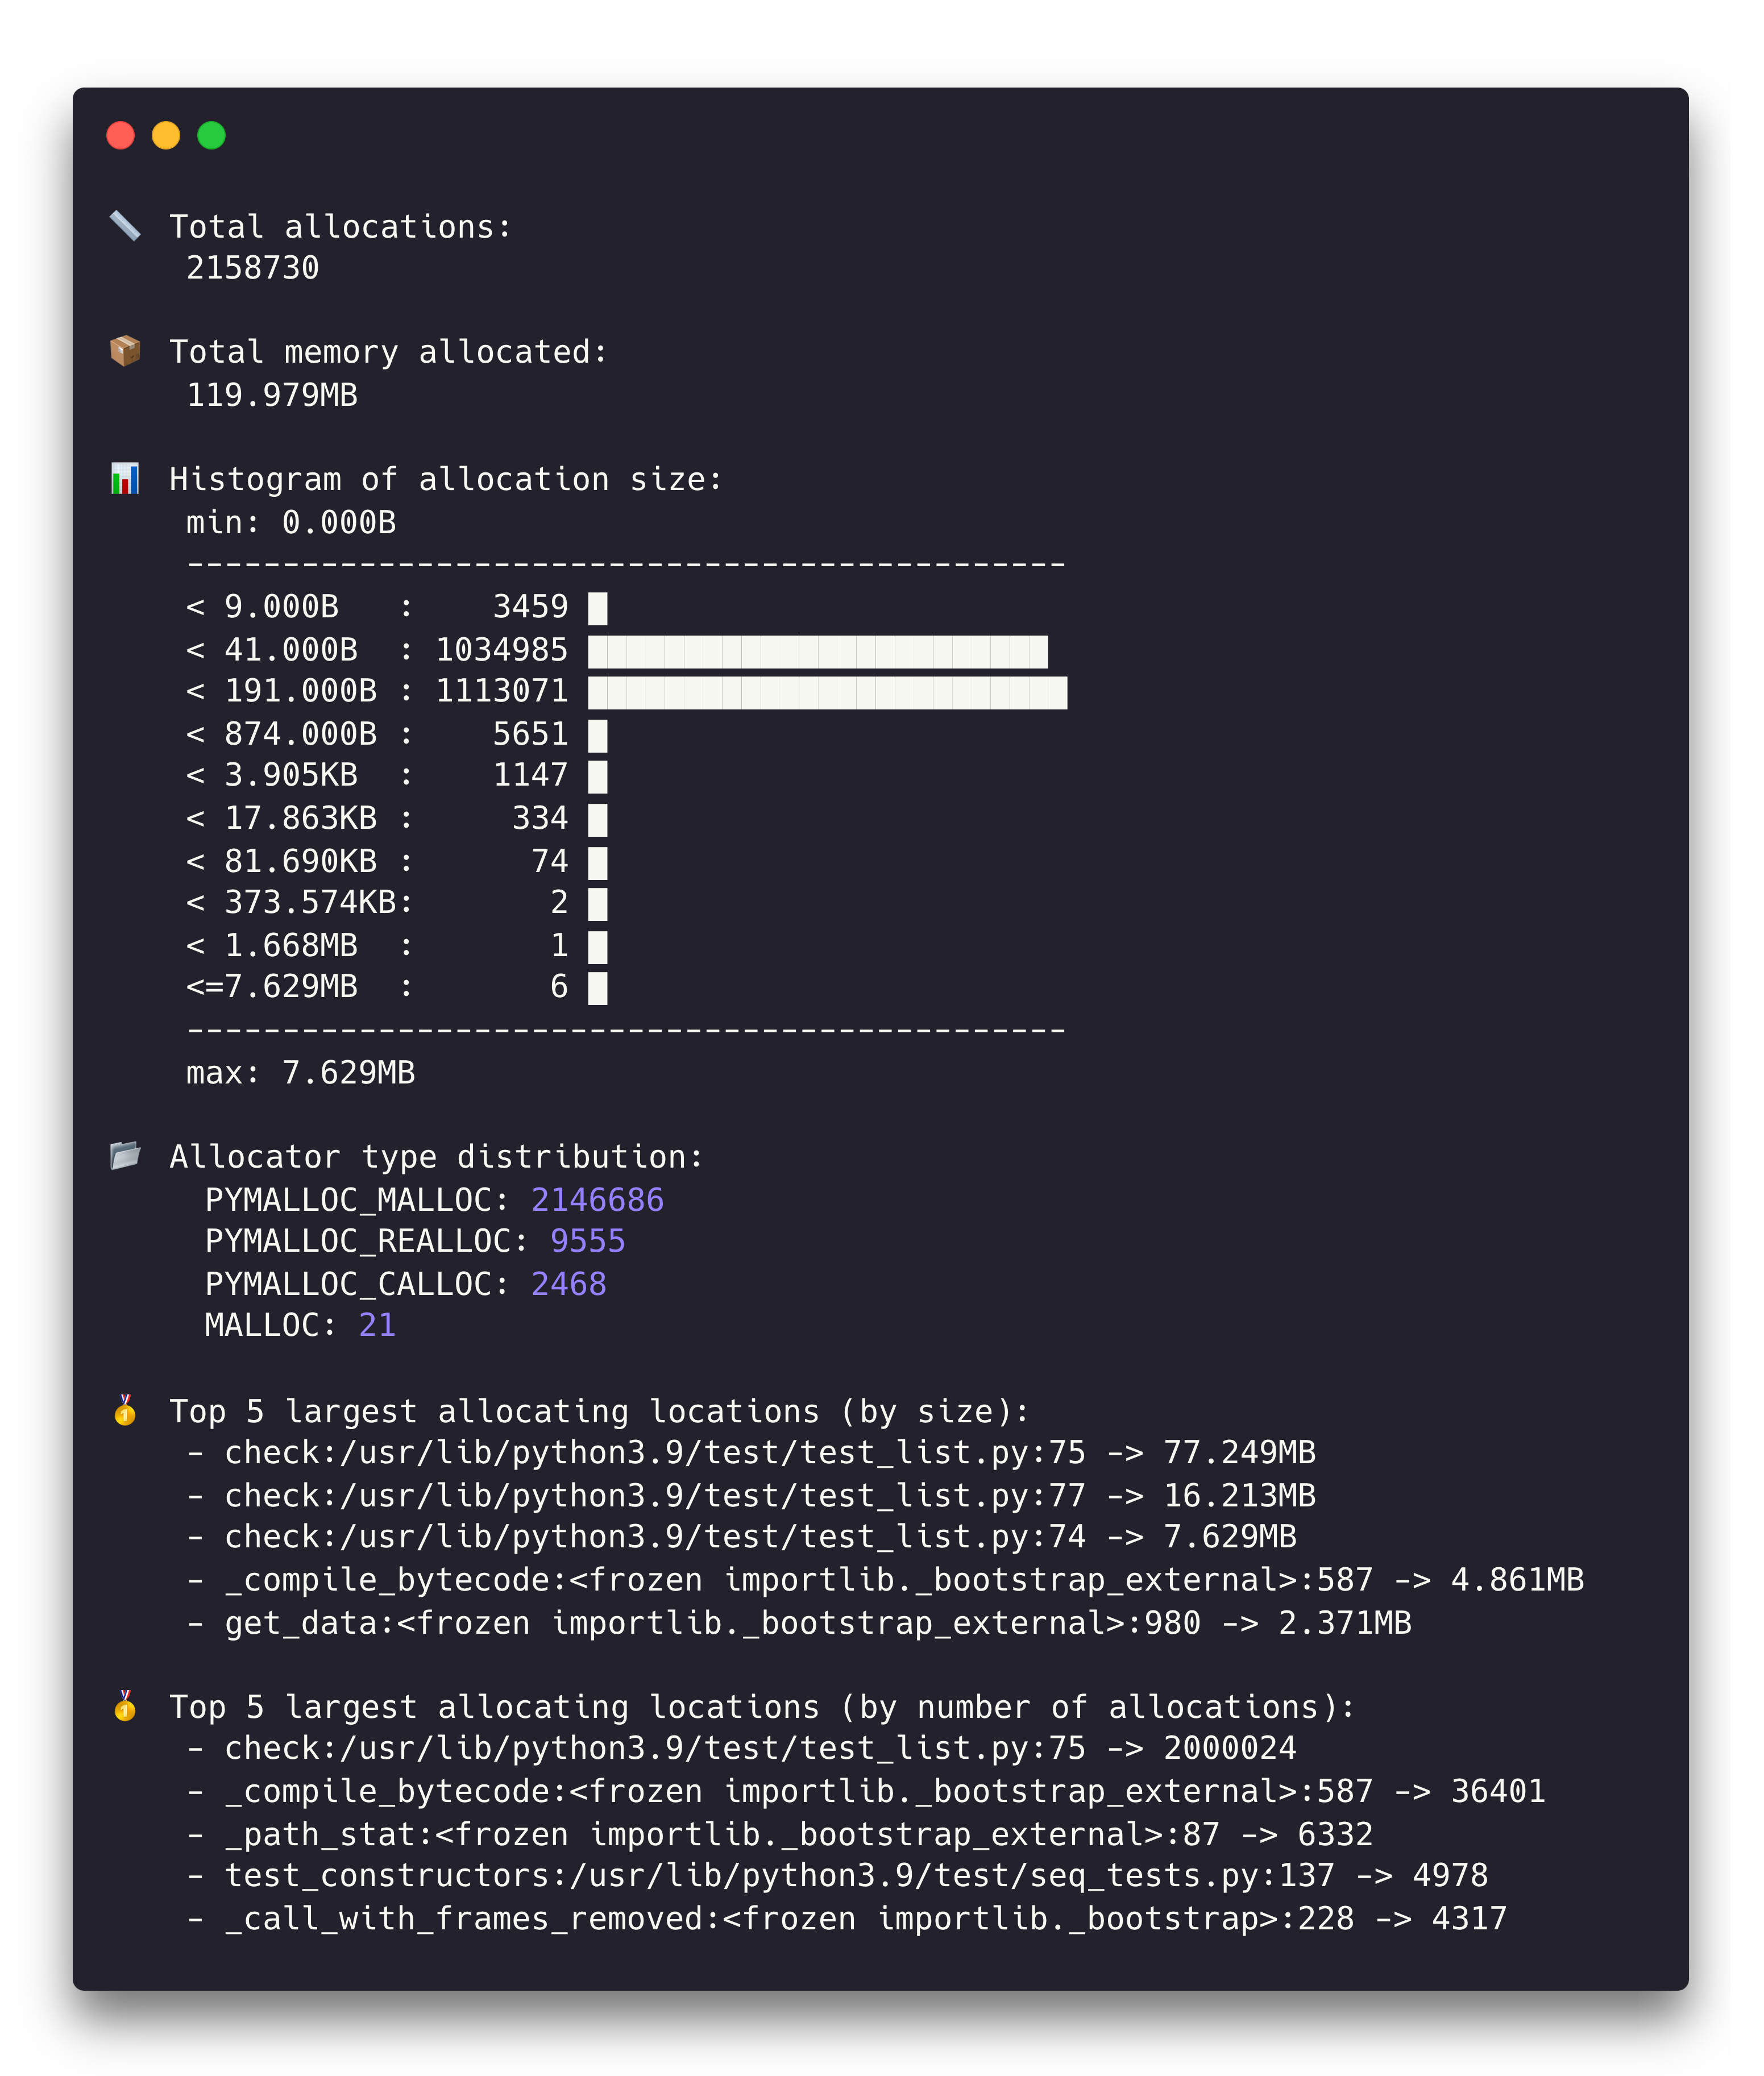
python3 -m memray run --live numpy_benchmark.py
native trace
nice log
集成到你的应用中
import memray
import os
import time

if os.path.exists('test.bin'):
    os.remove('test.bin')

print(os.getpid())

with memray.Tracker('test.bin'):
    ls = list()
    for _ in range(100):
        time.sleep(0.5)
        ls.append(' ')

print('test finish!')
我遇到的一些问题
浏览器无法渲染flamegraph
重启浏览器后解决了
重启容器后内存占用过高
docker使用了wsl2作为后端,在commit容器后,Linux的cache系统会占用大量的内存,要释放掉这些内存,仅需:
echo 3 | sudo tee /proc/sys/vm/drop_caches学习目的
- 了解内存profiling的套路
- 掌握内存调试的技术
- 总结cython在该场景下的优势
过程
简单地体验了memray文档提供的各种用例,并使用简单的numpy benchmark尝试了一下memory profiling,该工具确实能够将调用链路的内存占用暴露出来,非常好用;我更想知道该工具的原理了
初步解析原理
参考官方的discussions_225:https://github.com/bloomberg/memray/discussions/225
memray抓取了内存分配的信息,主要通过这些手段:
检测到内存被系统分配以及释放的时机(malloc, free, realloc)
将与这些内存事件关联的Python调用栈帧记录下来
native的栈帧同样也记录下来
获取python allocators的事件
任何的C以及C++扩展都动态链接了libc.so这个C runtime library,同时解释器进程本身也动态链接了该库,因此我们能够得知的是该库的malloc, free, realloc事件便是我们关心的事件
当进程链接了一个动态库,linker会创建一个映射表(procedure linkage table),里面记录了所依赖的库中的函数符号的指针地址,linux上的运行时载入器/lib/ld-linux.so.2
struct Entry {
    const char* symbol_name;
    intptr_t symbol_addr;
};
Entry entries[] = {
    {"malloc", NULL},
    {"free", NULL},
    {"strdup", NULL},
    {NULL, NULL},
};运行时期,上表中的entries内的地址会被填充(上述的表和每一个被依赖的库关联),使用Tracker时(进入recording的上下文管理器中),memray会将这些表的几个内存操作都替换成自身实现的函数,从而能够获取记录信息
编译安装
安装必要的依赖
yum install libunwind libunwind-devel
yum install lz4-devel
修改setup.py文件
MEMRAY_EXTENSION = Extension(
    name="memray._memray",
	# ...
    extra_compile_args=["-g", "-std=c++17", "-Wall", *EXTRA_COMPILE_ARGS],
    extra_link_args=["-g", "-std=c++17", "-lbacktrace", *EXTRA_LINK_ARGS],
    define_macros=DEFINE_MACROS,
    undef_macros=UNDEF_MACROS,
)


# ...
ext_modules=cythonize(
        [MEMRAY_EXTENSION, MEMRAY_TEST_EXTENSION, MEMRAY_INJECT_EXTENSION],
        include_path=["src/memray"],
        compiler_directives=COMPILER_DIRECTIVES,
        gdb_debug=True
    )
进行安装
python3 -m pip install --upgrade pip
python3 -m pip install -e . -r requirements-test.txt -r requirements-extra.txt
简单阅读代码
显然魔法发生在名为Tracker的context manager上
使用PyStack工具来hacking
调试代码
首先以args形式启动gdb
# 启动gdb
gdb -tui --args python3 import_memray.py

# 第一次运行,读取符号
run

# 展示文件
info sources

# 正则匹配符号
rbreak Tracker.*__enter__